



MAISON DE LA SIMULATION / The laboratory
HIVE-SA
High-resolution Immersive Visualization Environment for Scientific Analysis
HIVE-SA helps teams compare and discuss large collections of simulation and experimental results, either in the same room or from their own labs. It combines TiledViz, a tool for exploring results as a mosaic, with VRWall, a mixed reality version of the Mandelbrot display wall. Dedicated computing resources render the views for interactive analysis.
Visualisation as a service
Maison de la Simulation, a joint unit of CEA, CNRS, Université Paris-Saclay and UVSQ, hosts HIVE-SA and offers it to other research units. The team works with you from the initial discussion through data preparation, session setup and analysis, adapting the workflow to your scientific question.
Your data stay where they are hosted. We set up the visualisation tools near the data and stream the rendered views to a browser, the display wall or a headset. If you already use software for your field, we can integrate it. We take care of session setup, metadata, rendering and display.
How a project works
- Define the question. Tell us what you want to compare, where your results are stored and what tools you already use.
- Choose how to explore the results. Together we select a layout, the metadata for sorting and filtering, and the setting: the display wall, the touch table, a remote session or VRWall.
- Prepare the session. We configure the tools close to the data, integrate your software where appropriate and test the rendered views before your first session.
- Analyse together. Meet at Maison de la Simulation or join from your lab. We support the session and adjust the workflow as new questions arise.
Equipment for large datasets
Visualisation sessions can run near the data on your computing resources or on HIVE-SA’s dedicated GPU servers. The resulting views are streamed to the platform and displayed at high resolution.
The Mandelbrot room
- A 33-megapixel display wall, 4.3 metres wide, for comparing hundreds of images or live views while keeping fine detail visible.
- An interactive touch table and tablets for selecting, sorting and annotating results.
- A 20 m² collaboration space for group analysis and a 45-seat workshop room with telepresence equipment.
Rendering and mixed reality
- Eight NVIDIA RTX PRO 6000 GPUs for rendering several sessions in parallel and driving VRWall.
- 4 TB of RAM for keeping large datasets in memory during interactive exploration.
- Mixed reality headsets and XR glasses for sessions on site or in partner labs.
TiledViz: compare results side by side
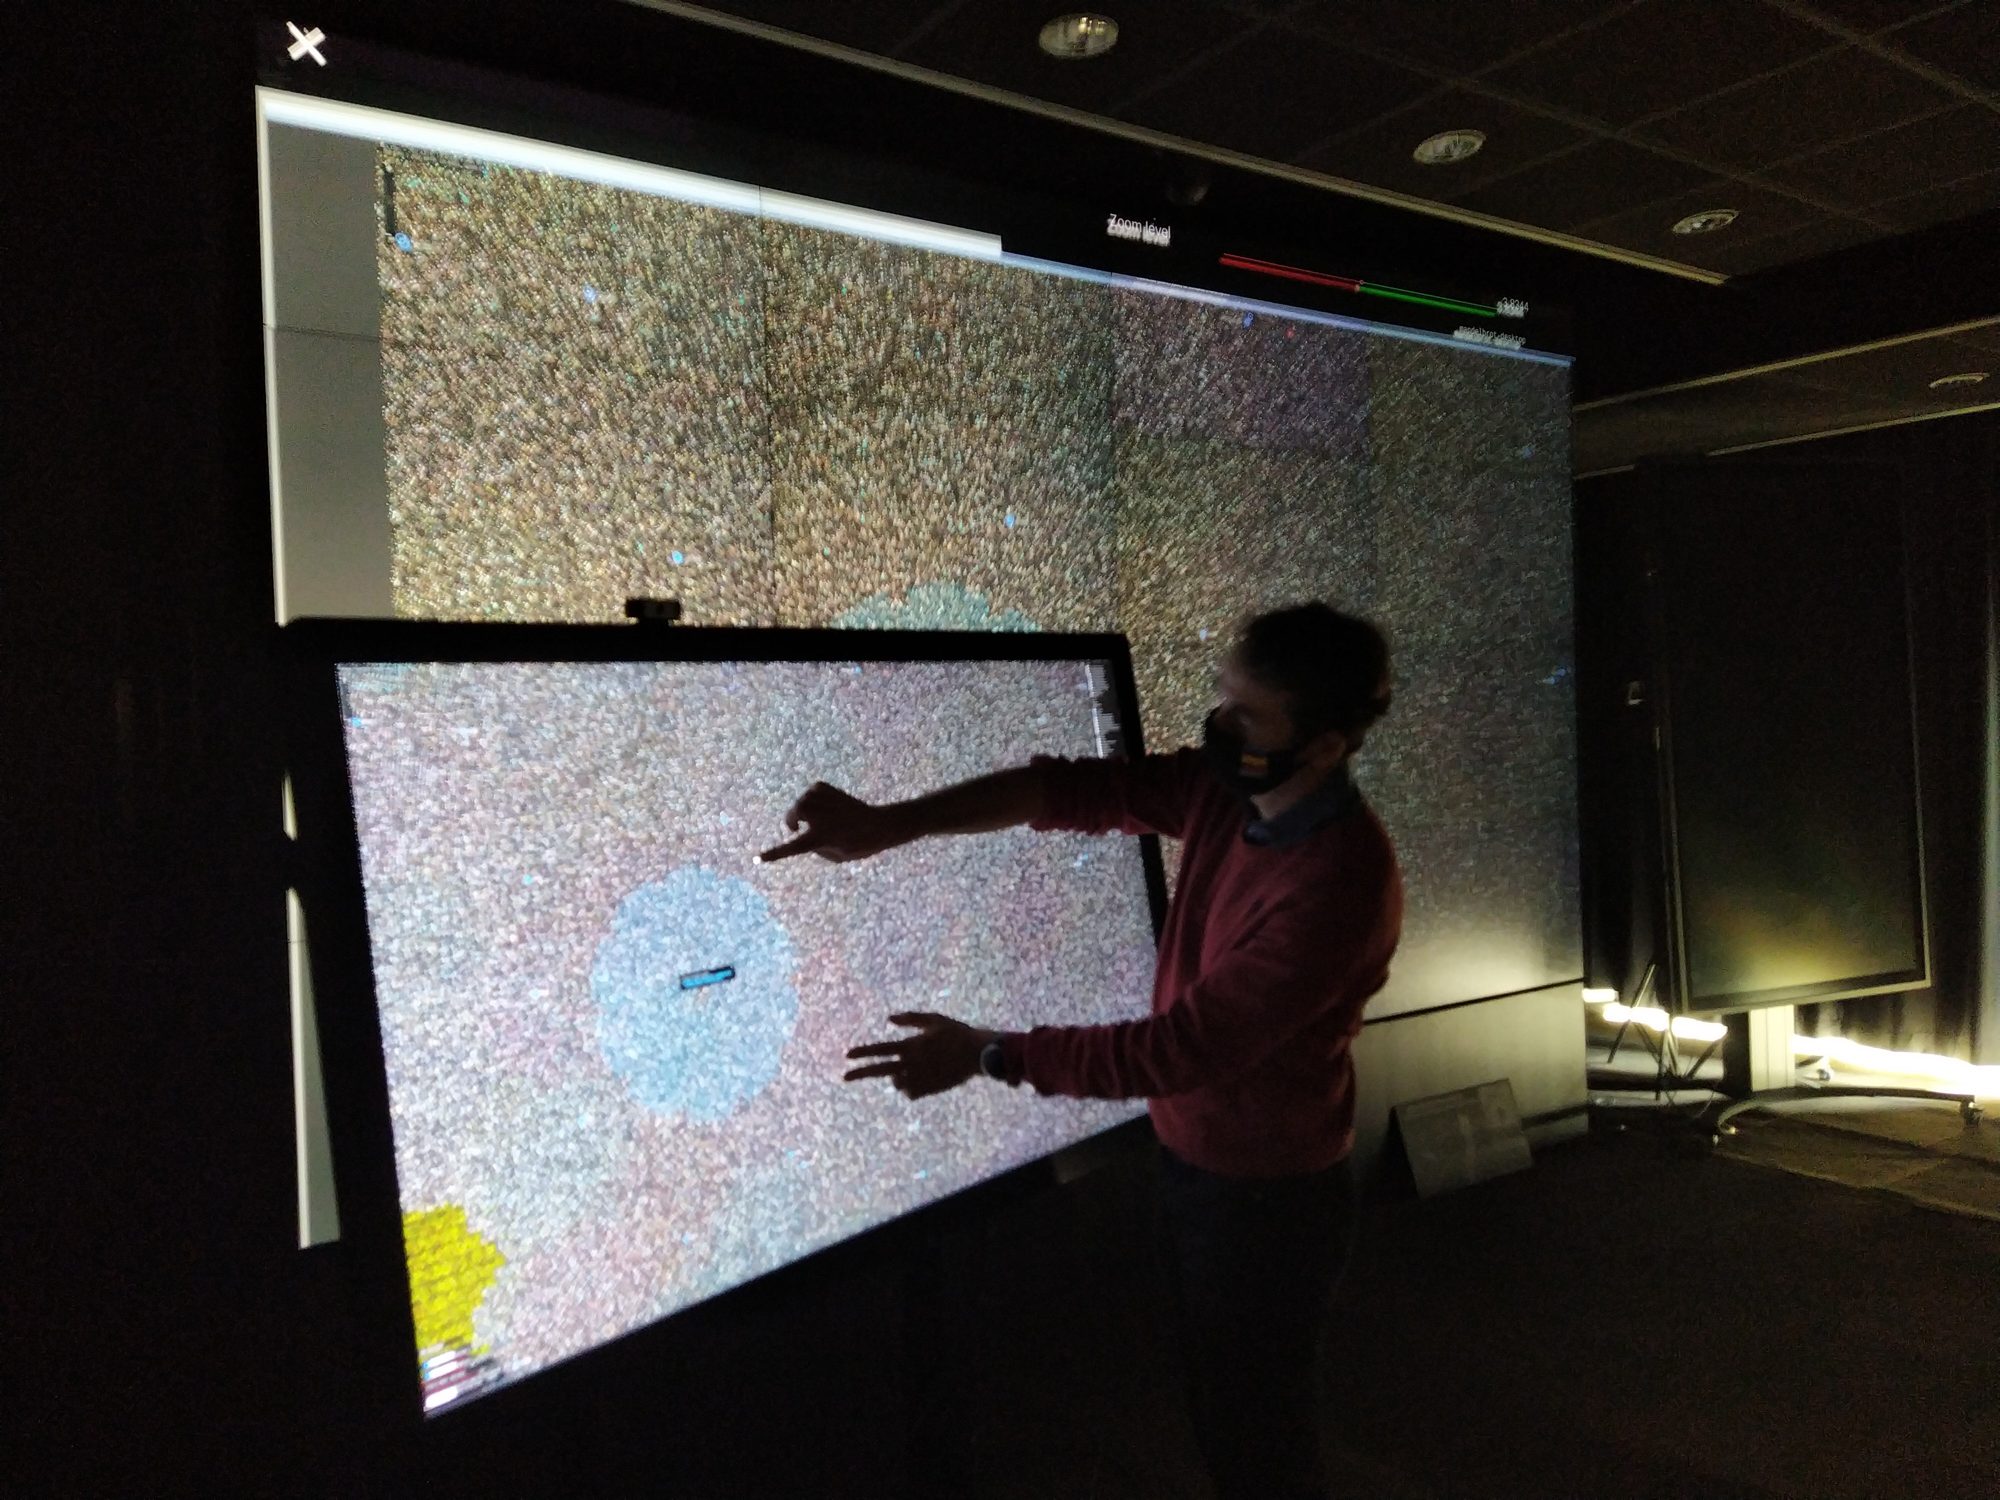
Developed by CEA and LISN (Université Paris-Saclay and CNRS), TiledViz arranges results from a post-processing server in a tiled mosaic. Teams can work together at the display wall, at the touch table or in a web browser. Tiles can show static images or live sessions streamed from a computing resource.
- Compare dozens or hundreds of results to examine parameter effects and spot trends or outliers.
- Sort, filter and group results using metadata from the underlying dataset.
- Manipulate, classify and annotate views, including interactive 3D results at the touch table.
- Stream live HPC sessions over secure VNC connections, with rendering in GPU-accelerated Docker or Singularity containers.
TiledViz is available under the Apache 2.0 licence. See the TiledViz source code on GitHub or the architecture and earlier use cases.
Research use cases
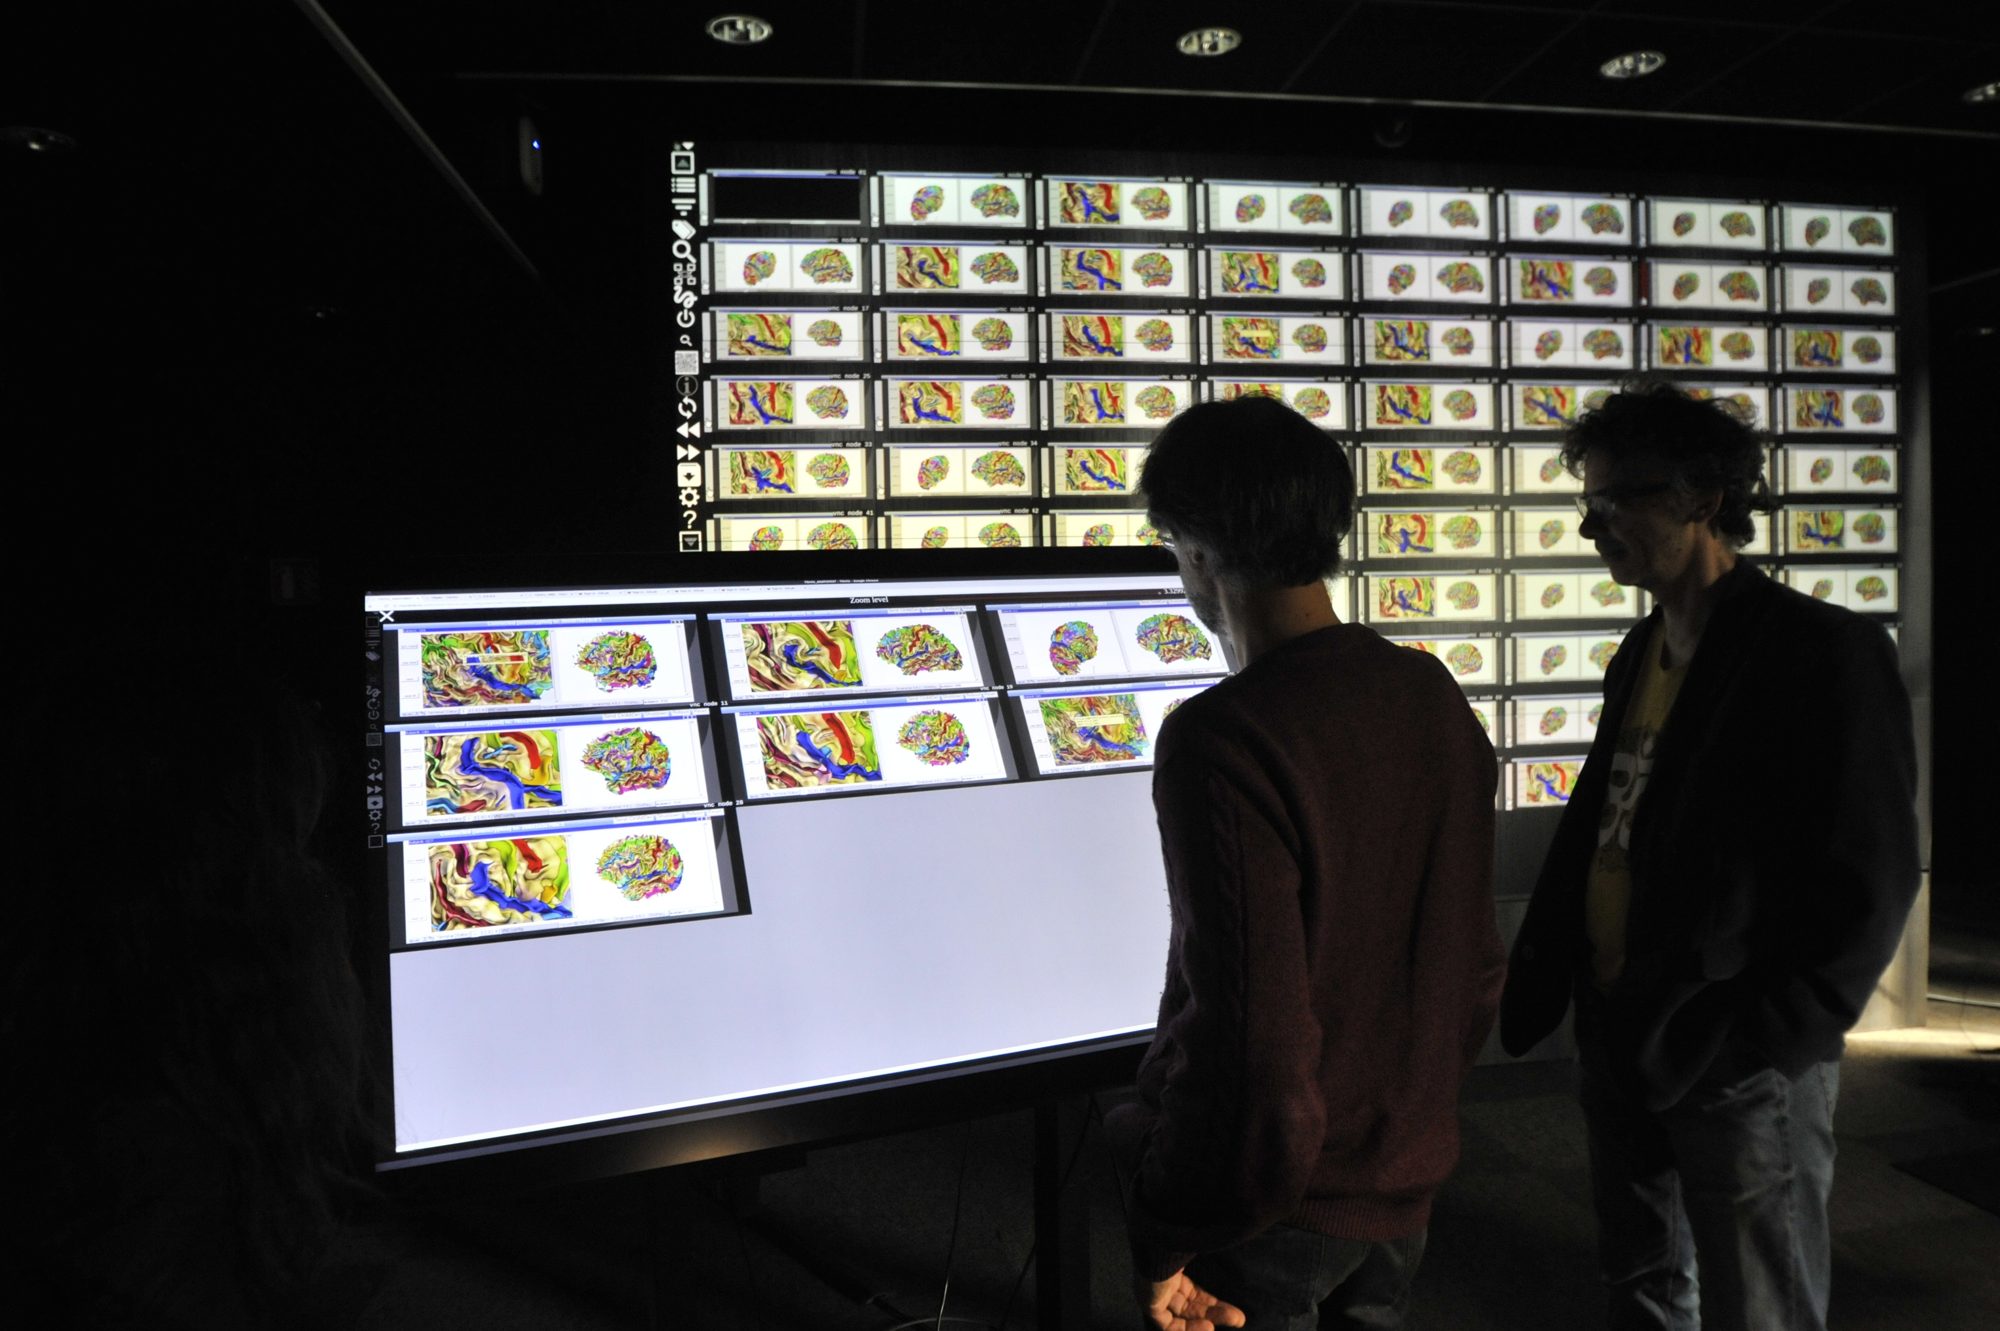
- Neuroimaging: study variation in cortical folds across brain imaging datasets with NeuroSpin’s UNATI laboratory.
- Giant exoplanets: compare simulations of Jupiter-like planets to see how their behaviour changes with the model parameters.
- Astrochemistry: examine molecular dynamics trajectories to study the formation of complex organic molecules in space.
- AI training data: let experts review and label many images together when preparing datasets for supervised learning.
VRWall: a virtual display wall in your lab
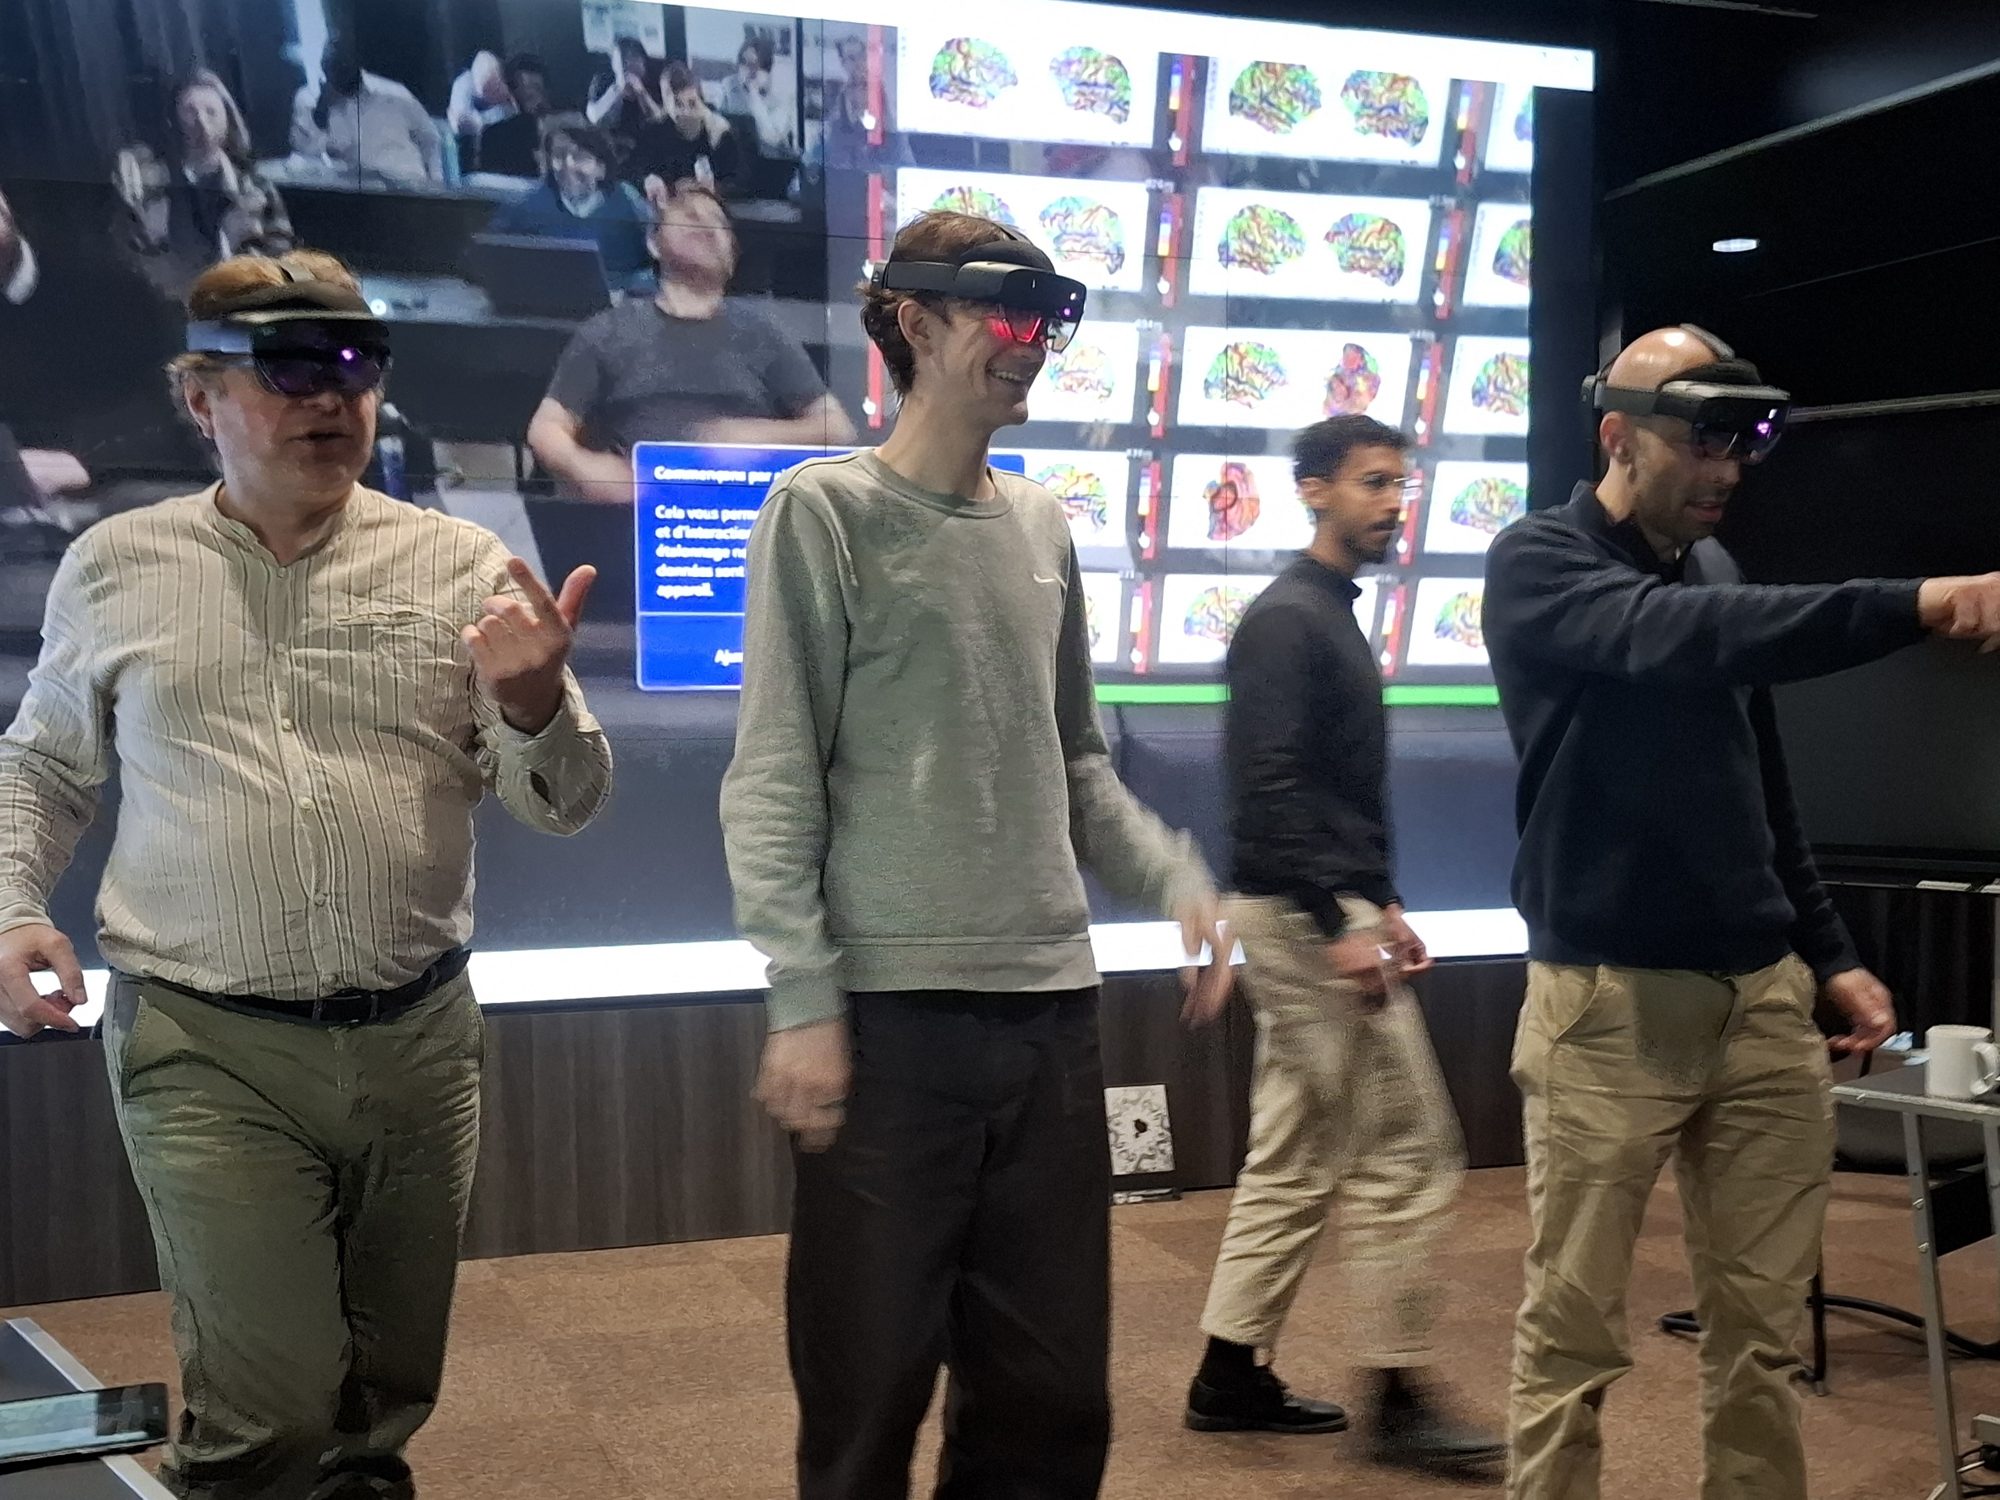
VRWall recreates the display wall in mixed reality. With a headset or XR glasses, teams can access TiledViz mosaics, high-resolution images and live sessions from their own lab. The platform’s GPUs render the virtual wall.
- Explore and manipulate large visualisations without travelling to the Mandelbrot room.
- Share the view for collaborative analysis, presentations and interactive demonstrations.
The Continuum network
HIVE-SA is part of Continuum, a CNRS-led network of around thirty visualisation and immersion facilities across France. Continuum is an eight-year EquipEx+ project launched in June 2021, building on Digiscope and Visionair. It is funded through France 2030, with ANR administering the programme. HIVE-SA is supported by CNRS and CEA.
The network brings together work on visualisation, immersion, interaction, collaboration and human perception across the sciences, humanities and social sciences. It supports equipment upgrades, connections between facilities for remote work, mobile visualisation equipment and specialist engineers. It also helps open these facilities to external research teams and companies.

Start a project
Tell us what your team would like to explore, compare or present. We will arrange a first meeting to discuss your data and how HIVE-SA could support your work.
Contact: contact@mdls.fr or Martial Mancip (martial.mancip at cnrs.fr).